

One of the trickier problems Redox engineering faces is maintaining hundreds of independent first-in-first-out (FIFO) health care message queues. In part 1 of this series, my colleague Brandon Palmer talks about the fundamentals of the system we created to solve this problem, and why it was necessary for us to write our own solution. This solution has worked well for us, but the downside of a home-grown system, is of course, maintenance. As the business has grown, we’ve needed to tune this tool to handle the increased volume of records flowing through our system. Today I’d like to walk through an example of how our team designed and executed an experiment to load test our FIFO queueing system, and isolate problematic queries.
Background
For quite some time, we’ve known that one of the major issues with our queueing system was depth dependence. As the number of jobs across our queues grew deep, our CPU would rise. We skirted around the issue for quite some time by scaling the queueing system horizontally – we separated our traffic onto various queueing shards (i.e. independent databases) to handle the growing load.
However, at the end of 2020, as our company continued to grow our customer base / message volume, we started to feel these CPU bottlenecks more acutely. To combat this, we started investing more of our time and effort into load testing capabilities to better understand and combat the CPU dependence.
In this particular experiment, we wanted to know which part of our queuing system was slowing us down, down to the query. In order to understand this, we designed an experiment to isolate the queue load at various stages of processing, and look closely at how the database CPU responds.
Before diving into the experiment set-up, there are a few important concepts to understand:
- concurrent processing – the phase of processing that can be done in parallel. Containers request jobs from the queuing database, allowing us to scale horizontally.
- sequential processing – the phase of processing where jobs are re-ordered. Like the concurrent processing phase, there are specific dedicated containers that will be responsible for sequential processing.
- For a record to pass through the asynchronous pipeline of our Redox environment, a message may pass through our queueing system twice – once to translate the incoming message to our internal data model, and again to map the outgoing transmission to an external organization.
To get a better sense of how these pieces fit together, see the following schematic. This is a sample flow with HL7v2 messages (a common health record standard) coming in from one organization, flowing through our Redox data-model, and going out to a different customer through their API. The cylinders represent our queuing database, and the squares represent clusters of specific flavors of processing containers.
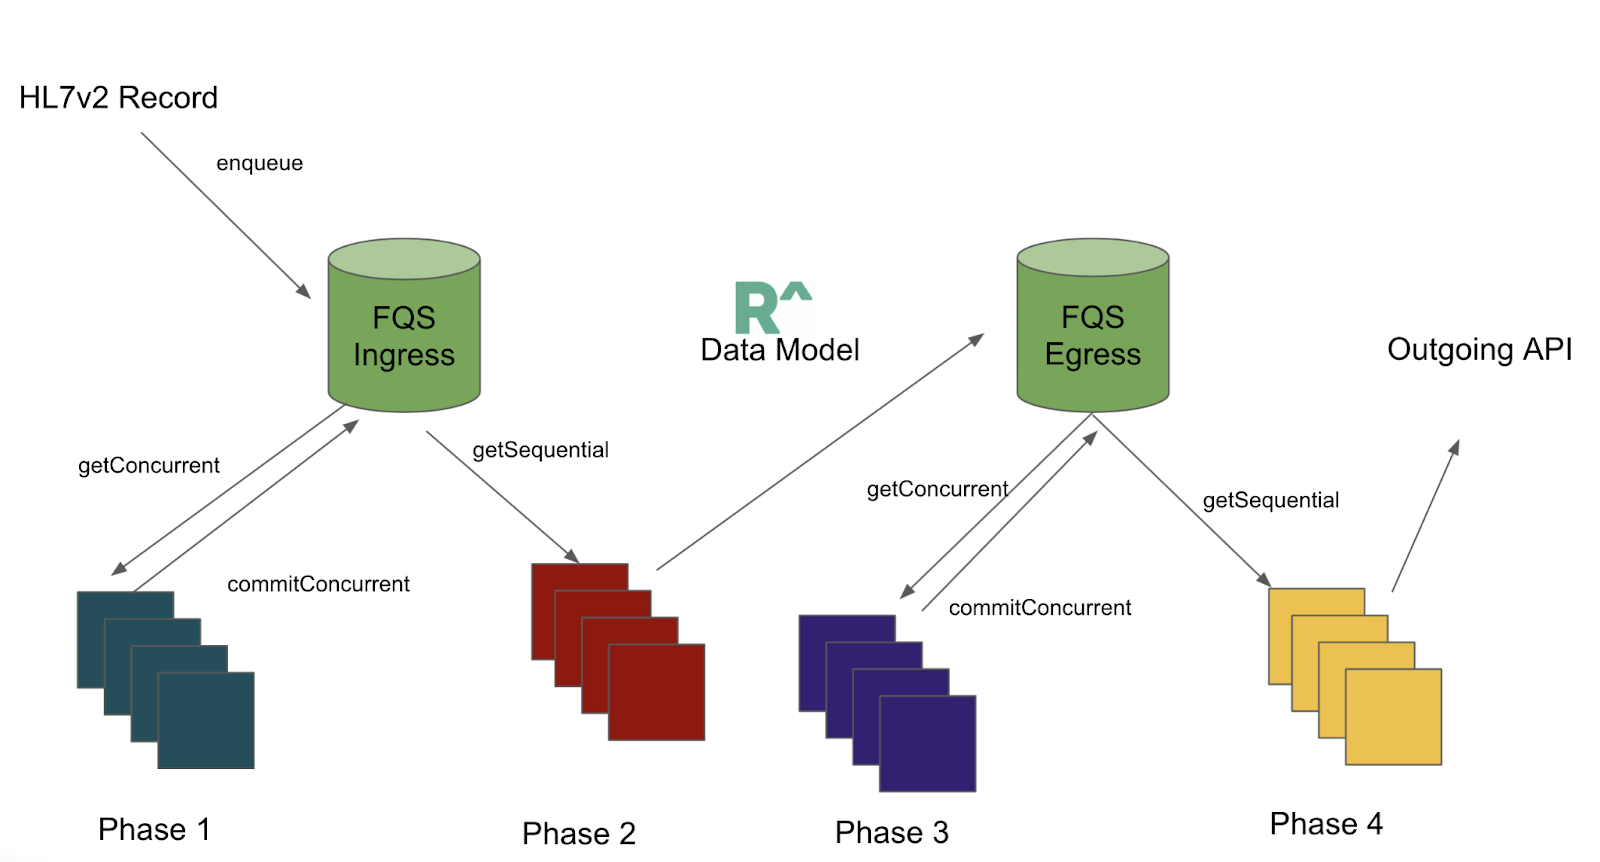

Notice it flows through the ‘FQS’ (internal name for our queueing system) twice – once on ingress, and again on egress. In our experiment, the ingress / egress databases are one and the same, but have been separated for conceptual simplicity in the diagram. The ingress queue is an independent queue from the egress queue.
Phases of Testing
With some of the background concepts out of the way, we can start to talk about ‘phase’ definitions for the experiment. In the production version of this system, each of these container types execute in an overlapping fashion. The goal of this experiment was to isolate queries by ‘type’ to identify the bottlenecks. Since certain container types are responsible for certain queries, we are able to isolate queries by controlling which containers are active.
Let’s define some phases. During ingress (phases 1 and 2), an incoming HL7 record is mapped to a Redox Data Model. During egress (phases 3 and 4), a Redox data model is prepared to be sent to an outbound destination API.
In each phase, a group of jobs is ‘promoted’ between the various statuses in either the ingress or egress queues. To achieve isolation, we wait for the entire group of messages to progress to the next stage before continuing. See the following diagram to understand this better. The way we ‘lock’ jobs – draining from one status, and populating the next, is by shutting off the previous phase’s containers, and then activating the next.
Phase 0: Load tester enqueues records

- The initial dump of messages was generated by a home-grown load testing tool – a light wrapper around the ArtilleryJS with mock health-care like data.
- The enqueue API endpoint initializes jobs with column status ‘Ready’.
- The ingress API containers are the only containers active in this phase.

Phase 1: Convert HL7 to Redox Data Model in Parallel

- Concurrent workers query for ‘ready’ jobs (getConcurrent), do their processing in parallel, and re-commit them to the database with status ‘processed-concurrent’ (commit-concurrent).
- During this phase, only the concurrent containers are active.

Phase 2: Queue jobs to External Processors

- Jobs are re-ordered as sequential workers query the database for jobs that have finished the previous step (‘processed-concurrent’), using timestamps from their original enqueue.
- In the same step we re-enqueue completed jobs into egress queue. These jobs enter the egress queue as ‘ready’.
- During this phase, ingress sequential containers and egress enqueue containers are active.

Phase 3: Convert Redox Data Model to Outgoing API format in Parallel

- Once all jobs are ‘ready’ on the egress queue, the transmission (egress) concurrent workers query the database for these jobs (via getConcurrent query), prepare them in the data-format necessary for the outgoing entity, and re-commit them to the database (commitConcurrent).
- These are analogous workers to those in Phase 1. The queries are nearly identical, but they are looking for different job tags, and the workers have different mapping procedures.
- Only these transmission (egress) concurrent containers are active in this phase.

Phase 4: Re-order, and send records outbound

- Similar to phase 2, once all the jobs have been processed in parallel, the sequential containers will re-order them (via getSequential query) to ensure they are sent out in FIFO order.
- Completed records are sent outbound customer API (which, in our case was a dummy test destination).
- Only transmission (egress) sequential containers are active during this phase.

Controls
To maintain isolation and consistency between phases, we implemented the following experimental controls:
- Each processing phase has the same number of records. In fact, they are the same records that pass from one phase to the next.
- Each phase uses the same number of worker containers.
- Only workers pertaining to a particular phase were active (i.e. concurrent message containers were the only ones scaled up during Phase 1, etc.). All others were scaled to zero.
What we learned
Some queue statuses were more expensive than others
First, let’s just take a simple look at the overall CPU characteristics as a function of time and phase.

- Peak 0 correlates to the initial load tester’s dump of messages
- Peak 1 happens as Phase 1 completes.
- Peak 2 happens as Phase 2 begins.
- Peak 3 happens as Phase 3 completes.
- Peak 4 happens as Phase 4 begins.
This already shows us something interesting. Recall that the ingress and egress databases are actually the same data-store, and only separated in the diagrams for conceptual purposes. We would expect the number of records in the database to ramp up from phase 0 – 1, remain constant between phases 1, 2, and 3, and then slowly drain out over phase 4. The only difference between the phases should be the ‘status’ of the jobs, and the queue they reside in (ingress vs egress). If the database were merely depth dependent, we would expect the CPU to ramp up leading to phase 1, stay flat through phase 3, and then ramp down during phase 4 as the records exit the system.
However, what we see instead are peaks at the end of Phase 1, and then again at the start of Phase 3. In both phases 1 and 3, the number of processed-concurrent jobs increase (on the ingress or egress sides, respectively). What this suggests is that performance degradation is tied to the depth of status processed-concurrent status specifically. Since status is implemented as a column in our database, this was a clear signal on a potential area of improvement.
Identifying the problematic queries
In this next graph, we tracked timings corresponding to different queries. We aggregated each type of query by summing across all containers. Each query type is denoted by a different color.
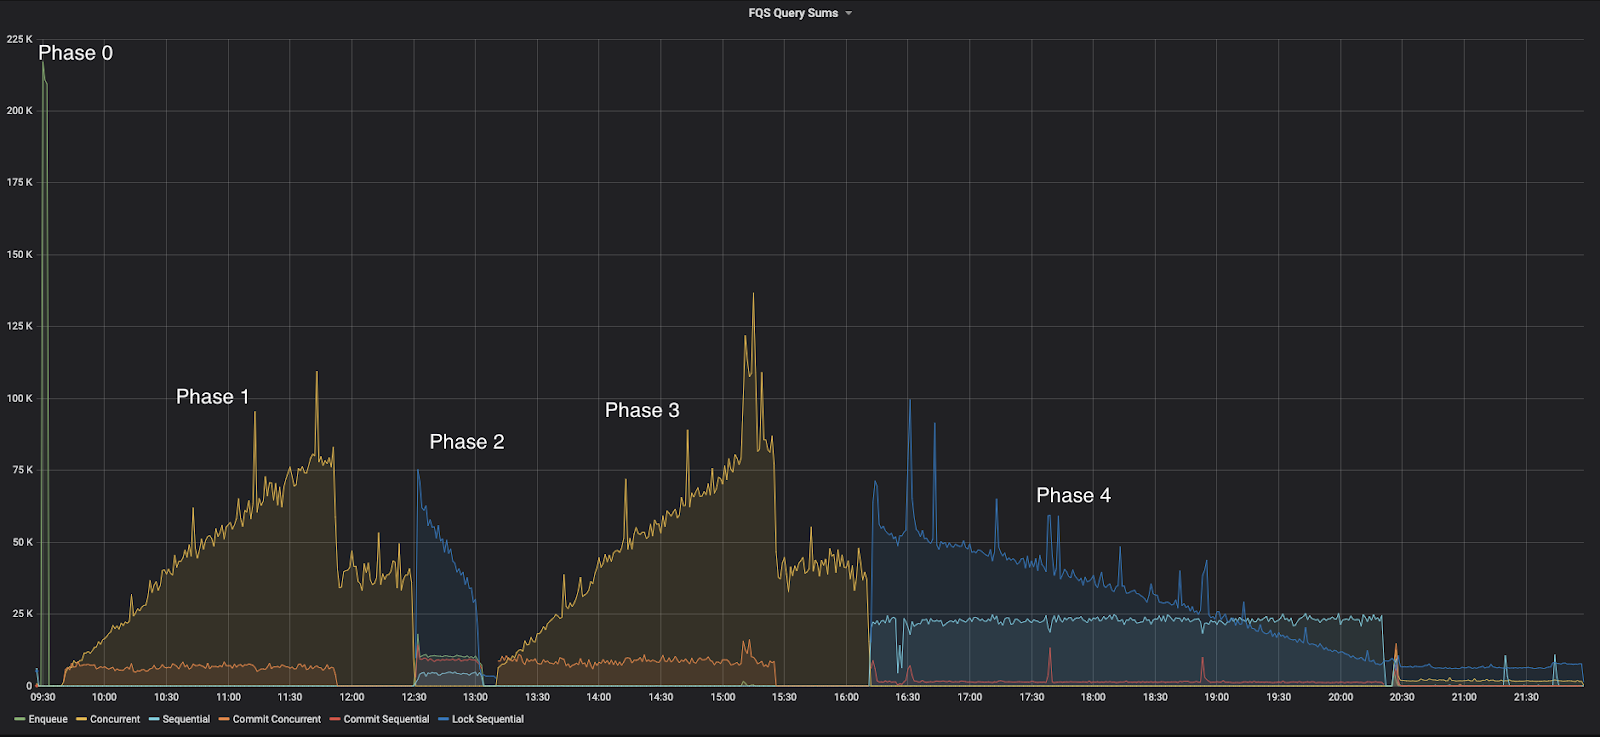
There are a couple of different result characteristics to pay attention to. Some query timings are flat over time. These are great because they do not show depth dependence. These are characteristic of the sequential queries, as well as commit-concurrent queries.
The other query character is a bit more sinister – it has an almost linear dependence with queue depth. This is a sign of a scaling bottleneck, since it will ultimately cap the total number of records that can exist within the system at one time. After these experiments concluded, we started to focus on the concurrent (yellow) query, as well as the locked-sequential (dark blue) query because of the linear queue dependence.
Conclusion
Looking back at this experiment, this investment of time was a good one. Although the actual fixes / improvements that addressed the issues came in later sprints, these learnings were a crucial stepping stone. We learned that our queueing system is particularly sensitive to the status of its jobs, even if the number of jobs within the database remains constant. We also learned that the ‘processed-concurrent’ status was particularly important / CPU intensive. We also had two specific leads on queries that exhibited depth dependence, which we could target for optimization.
For the next chapter in this story, stay tuned for my colleague’s post on “Idea to Implementation”, where we will discuss how we came up with one of the solutions to the depth dependence discussed here.
This is part two of a series. Read part one and part three for more information.
Stay in the know! Subscribe to our newsletter.
Related Posts

2024 HL7® FHIR® DevDays Top 5 takeaways (a newbie’s take)
Brendan from our Solutions Engineering team explores the current state of HL7® v2 and HL7® FHIR®, and how Redox can drive a FHIR-based application experience even when data exchange partners prefer to use HL7 v2.